How to use online presentation tools:
|
Infographics
An infographic is a graphic, visual representation of data and/or information. Infographics are used to present information quickly and clearly. You can think of infographics as "online posters". When creating an infographic, you may include tables, graphics, charts, symbols, words, and color. Infographics are much easier for the viewer to understand the information quickly. Make your infographic interesting and informative -- don't clutter your infographic, and use space and color wisely. Think about what you find interesting and how you like to learn. Here are some good examples of infographics (or do a Google image search for infographics). The most important step of creating an infographic is PLANNING. Look at the information you have. What are the most important parts to convey? How can you convey it in a clear, concise manner? Read this about structuring your infographic. Both Easel.ly and Piktochart are great FREE tools for creating infographics (there are many other sites as well). Both have free templates (the template is just a starting point and is completely customizable, so don't be afraid to change the colors, shapes, icons and organization). You will need to create an account and don't forget to save as you go! When you are done, you can download your infographic as an image or a PDF file. The videos on the right are tutorials for both Easel.ly and Piktochart. There are many other tools (some free) to help you create an inforgraphic. Other infographic tools are described here. |
What makes an effective infographic?Creating an infographic with Easel.ly:A playlist of Easel.ly tutorial videos can be found by clicking here.
Creating an infographic with Piktochart:Click here to access a playlist of Piktochart tutorial videos.
|
|
Prezi
Prezi is a presentation tool that can be thought of as a virtual whiteboard. Prezis are great visuals -- they allow users to see the whole and the parts of the presentation. Using Prezi for the first time? Need some refresher tips? This video from Prezi goes over the basics in just 2 minutes. For more a more in-depth tutorial video, click here. To learn how to use the more advanced features of Prezi, please click here and here. Go here or here for step-by-step written instructions/how-to tips. |
|
|
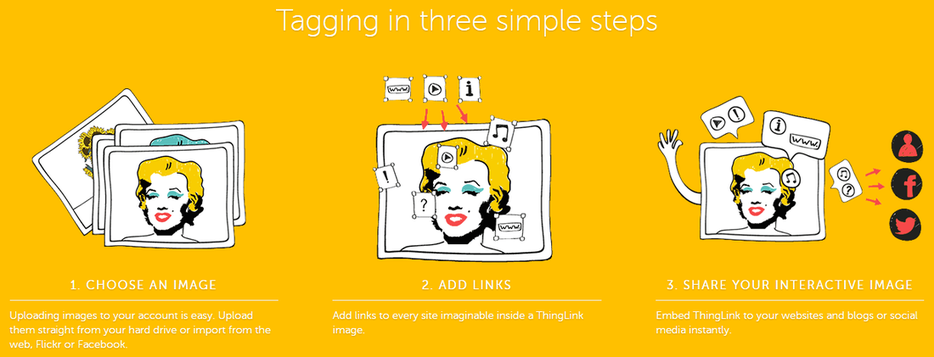
ThingLink
ThingLink is a tool that allows users to transform an image into an interactive, multi-media graphic. Add video, text, images, music, links to websites, news articles and more. The image below gives an overview of how to create a ThingLink. It really is that easy to use. Click here or here for written step-by-step instructions/how-to tips. If needed, watch the video tutorial on the right... ignore the assignment instructions, just pay attention to the features of ThingLink. |
|
|
Powtoon
Powtoon is a presentation tool which allows users to create animated presentations. These presentations are built on different slides, but each slide can have animation, as well as video, audio, images, links, and text. This is a good tool to tell a story, in fact, "storyboarding" your presentation before creating your Powtoon makes the process go more smoothly. The tutorial video on the right from YouTube user Jen Jonson is a great step-by-step explanation of how to put together your first Powtoon. |
|